Why We Love Alcohol

Introduction
2020 has been one of the most stressful years of my life, and I (like many others I assume) wouldn’t have been able to make it through without alcohol. Alcohol consumption has increased signifiantly as a result of the stay at home orders, and public distress. But why is this? Am I a horrible person for downing an entire bottle of cheap gas-station merlot after work? Perhaps.. But despite what most religious organizations would have you believe, the desire to drinking alcohol is encoded in our DNA. In fact, our interest in alcohol dates back over 6,000 years. But how did alcohol become part of our biological history? The answer to this question can be understood by understanding yeast, one of the first organisms that humans domesticated. In particular, we will take a look at a certain species of yeast called Saccharomyces cerevisiae, which is capable of brewing wine.
The Diauxic Shift
The yeast S. cerevisiae often live on grapevines.
It converts glucose found in fruit into ethanol.
In hopes of understanding let us ask the following question:Why do crushed grapes need to be stored in tightly sealed barrels in order to produce alcohol?
More importantly, once the supply of glucose runs out, how does the S. cerevisiae survive?
It survives by inverting it’s metabolism and using the ethanol which it produced as a source of energy.
Imagine if humans could do this.
This metabolic inversion is known as diauxic shift. And the reason why crushed grapes need to be stored in tightly sealed containers is due to the fact that diauxic shift can only occur in the absence of oxygen. Neat! Are other organisms capable of this kind of metabolic inversion? No idea. But one way to find out is to analyze the genes which are responsible for the diauxic shift in S. cerevisiae.
Which Yeast Genes are Respobsible for Diauxic Shift?
Let’s conduct a thought experiment. We have a list of yeast genes \(\{g_1,\dots,g_n\}\), and we are going to record the gene expression level of each \(g_i\) starting six hours before the diauxic shift, and repeating the measurement every two hours until six hours after the shift has occured. Let \(m=\{-6,-4,-2,0,2,4,6\}\) denote these hour checkmarks. We can arrange these measurements in the form of an \(n\times m\) matrix \(E\), known as the gene expression matrix, where the \((i,j)\)-entry of \(E\) is given by \(\begin{equation*} E_{i,j}=\text{gene expression level of }g_i \text{ at time j} \end{equation*}\) and each row of \(E\) is a gene expression vector. S. cerevisiae has approximately 6,400 genes. Using the same time checkpoints, the gene expression matrix for S. cerevisiae will have 6,400 rows and 7 columns.
What Does the Gene Expression Matrix Tell Us?
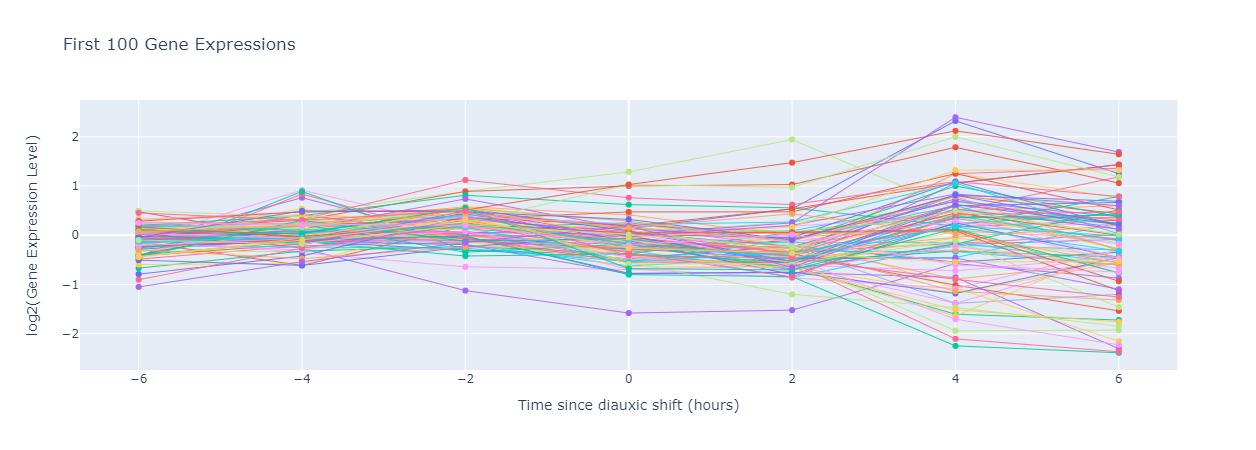
We can visualize the gene expression level of each gene during the experiment, as shown below (It’s common to scale the gene expression level logarithmically).
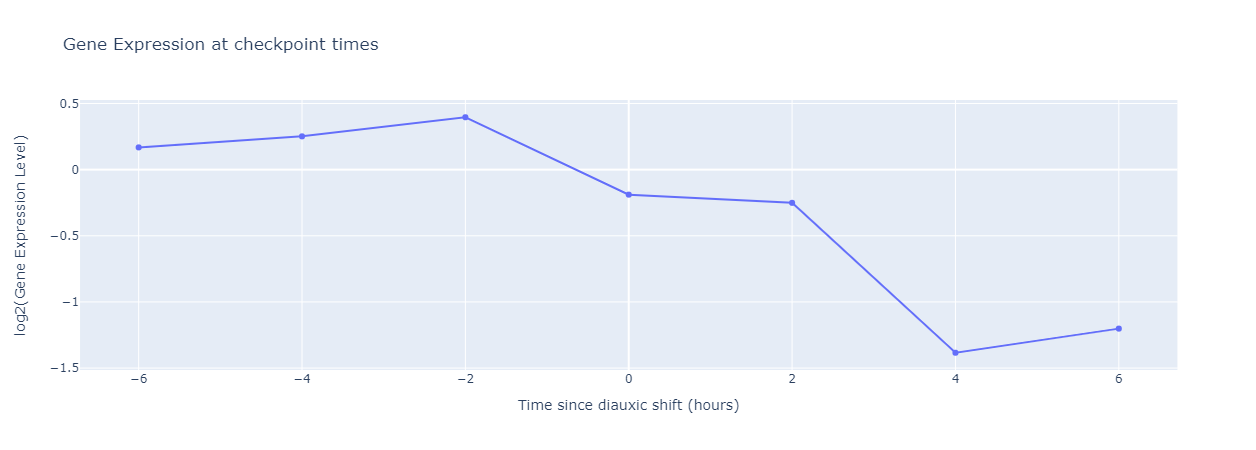
In this figure, the gene expression level decreases and becomes negative after the shift, which implies that this shift corresponds to a decrease in the expression of this gene. Similarly, a flat curve would imply that the gene is not involved in diauxic shift, and an increasing curve shows an increase in gene expression due to diauxic shift.
Clustering Yeast Genes
Genes with similar expression vectors may imply that the genes are co-regulated, meaning that their expression is controlled by the same transcription factor. With this fact in mind, if we cluster together expression vectors which exhibited similar behavior during the experiment, we can determine which genes are co-regulated.